Technical Note
Torrent Suite SoftwareAnalysis Pipeline
The analysis pipeline is the primary software used to process raw Personal Genome Machine (PGM) and Proton Sequencer acquisition data to produce read files containing high quality bases. This document provides an overview of the software modules and concepts applied at various stages of the data processing.
Introduction
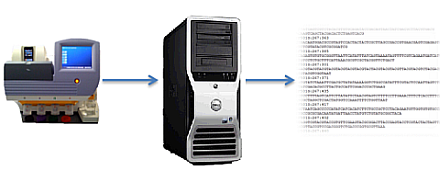
The Torrent Suite Software analysis pipeline, the "pipeline", processes raw acquisition data from a PGM or Proton Sequencer run, and outputs base calls in unmapped BAM file formats. The Torrent Browser provides a web interface to the process, including many metrics, graphs, and reporting features derived from the pipeline results.
The following figure shows a conceptual overview of the pipeline:
The following sections provide additional, detailed information about the analysis pipeline modules that work together to convert the raw acquisition data into high-quality base calls and reads.
Background
Although the focus of this document is on the analysis pipeline itself, a few concepts are presented here for review.
During a PGM or Proton S equencer run, for each nucleotide flow, one acquisition file is generated. Each acquisition file contains the raw signal measurement in each well of the chip for the given nucleotide flow. So each acquisition flow, for an Ion314 chip, contains roughly 1.5 million separate incorporation events. A series of such acquisition files represents the roughly 1.5 million possible reads. The analysis pipeline converts these raw signal measurements into incorporation measures, and ultimately into base calls for each read. The raw measurements are the conversion of the raw pH value in each well into a voltage converted into a digital representation of that voltage. This measurement over the entire chip occurs many times per second.
Analysis pipeline modules
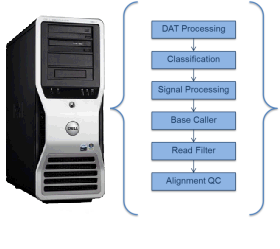
The following figure shows the high level modules within the analysis pipeline. Each module accepts specific inputs and produces specific outputs, described in more detail, below.
DAT processing
The DAT processing module deals directly with raw acquisition files (
acq_*.dat
).
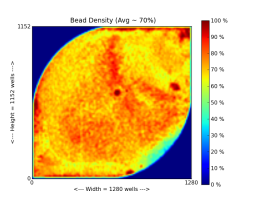
The following figure shows an Ion314 chip heat map, which indicates percent loading across the physical surface:
DAT processing performs the following functions:
-
Raw acquisition data loading into memory.
This includes decompressing the data files. Data is compressed when it is streamed off the PGM or Proton sequencer:- An optional dynamic frame rate compression mode whereby various portions of the incorporation event throughout the nucleotide flow duration are captured at different frame rates. The variable frame rate permits biologically specific events to be captured with high resolution while averaging multiple frames where appropriate, giving a reduction inoverall file size.
-
A compression approach may use a keyframe/delta compression technique whereby an initial value is stored, followed by the changes in that initial value, rather than storing the actual value each time. This results in a nearly 2x reduction in file size.
-
Raw measurement offset corrections.
Raw acquisition data are stored using the values output by the chip. Each well has its own reference value, and to compare well to well, the two wells may use a common reference. The offset correction takes the average of the first few frames within each acquisition file and subtracts that value from each well, thus permitting well measurements to have a common reference value.
-
Pinned well identification.
Due to the nature of the chip output voltages, a range of values exists for any given chip. The PGM and Proton sequencer calibration code brings the majority of wells within range of the hardware analog to digital converters. The output is a distribution of values centered around the center voltage. Wells that reside outside a selected distribution are considered "pinned" (functional wells outside of the range of the Analog to Digital Converter (ADC)). These pinned wells typically represent fewer than one percent of the total available wells. -
Excluded Wells.
Various flow cell configurations often make tradeoffs on flow velocity profiles and chip coverage areas. For the Ion 314 chip, for example, a percentage of the wells are covered by the flow cell and are not fluidically addressable. A mask is loaded, per chip type, to mark those wells as excluded so they do not complicate down-stream processing of the chip.
Default sequencing keys and flow order
The next part of the classification module involves identifying particle wells as test fragments (TF) or library fragments. To understand this part of the algorithm, the concept of "keys" and flow order must first be understood.
The following table shows the default library and TF sequencing keys in both base-space and flow-space for the default,TACG,flow order:
|
|
Base-space |
Flow order TACG vector |
|---|---|---|
|
Library Key |
TCAG |
1010010X |
|
TF Key |
ATCG |
0100101X |
The "X" in the vector column indicates that the value is at least a one, but could in fact be higher because the next base after the key could also match, thus creating a longer homopolymer.
Classification
Classification is the process of determining the contents of each well on the chip. The primary purpose of classification is to determine which wells contain particles with template for sequencing and which wells are empty for use in background estimation during signal processing. The figure below illustrates the nested classes of classification.
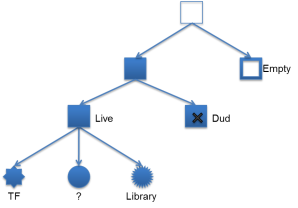
A well can either be empty, contain a particle or be flagged as an outlier. Wells are flagged as outliers if they do not appear to be responding appropriately to the nucleotide, are not fitting the model well or are wells marked empty that appear to be buffering. For wells containing a particle, the process additionally determines if the particle is:
- A library particle.
- A test fragment (control) particle.
- A dud particle (a particle that does not produce a sufficiently strong sequence signal).
It is important to note at this point that classification is not simply processing the entire chip as one group. As is mentioned for other pipeline modules, the chip is processed in smaller regions. An Ion 314 chip, for example, is divided into on the order of 50x50 well regions, resulting in about 625 total regions. This enables processing many small regions in parallel and taking advantage of multi-core/multi-process compute nodes that have such capabilities. More importantly, regions in the chip are processed that contain fluidically similar wells, where smaller regions tend to be relatively homogeneous and facilitate comparing wells to each other within a region.
Key classification
Each well is checked to see if it is producing sequence that matches any one of the keys. A model is fit and the key with the best fit is assigned to that well. If no key has a high enough score then the well is not assigned to the live classification and will not be processed downstream.
With the default keys and flow order, above, there are two vectors in flow space:
             Nuc Flow:  TACGTACG
Library:   1010010
Test Frag: 0100101
Each key is tested to see if it fits the expected behavior of similar signals in the 1mer flows and no signal in the 0mer flows. Note, as mentioned above for these keys, the last 'G' flow is not used in the model fitting. There could be another G following in the template sequence which would mean that in some cases the incorporation may be a 2mer, 3mer, etc. and not fit the model. A key must have at least two 1mer flows and two 0mer flows to be valid for sequencing.
Mask
The output of the classification module is a mask object (and file as
bfmask.bin
) that contains bit flags for each well, indicating the contents of each well.
Signal processing
The signal processing module focuses on wells containing particles, which is now using the mask information in addition to the raw acquisition data. The following figure shows a conceptual representation of the signal measured in a well during an incorporation event.
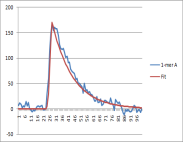
This signal has additional components, referred to as "the background". This background part of the signal is present during each flow and can vary over time, across the chip, and during an acquisition. The signal processing problem can be thought of as having two parts:
- The first part involves deriving the background signal that would have been measured in a given well, had no incorporation occurred.
- The second part involves subtracting (or fitting) the background signal and examining (or fitting to) the remaining signal. The output of the incorporation fitting model produces the estimate of the incorporation at each nucleotide flow for each well.
At this point, the output from the analysis pipeline is a raw incorporation signal measure per well, per flow, stored as a
1.wells
file.
Basecalling
The basecaller module performs phasing parameters estimation, signal normalization, and determination of base calls and quality values for each well.
Basecaller is equipped with a generative model of phasing that allows it construct an artificial, expected incorporation signal for any base sequence. The generative model requires knowledge of model parameters that are obtained during the phasing parameter estimation stage preceding basecalling. The goal of basecaller is to determine the most likely base sequence, i.e., the sequence for which the expected incorporation signal best matches the observed incorporation signal stored in 1.wells file. Once the most likely sequence is found, any remaining difference between expected and observed signals influences the assignment of quality values. The results of basecalling, after the additional steps of filtering, trimming, and barcode classification, are stored in unmapped BAM format.
Additionally, the basecaller must normalize the observed incorporation signal for best fit to the predicted signal.
The three parameters controlling the generative signal mode are carry-forward (CF), incomplete extension (IE), and droop (DR). CF and IE control the rate of out-of-phase polymerase buildup, while DR measures DNA polymerase loss rate during a sequencing run. The chip area is divided into 64 regions, each of which receives its own, independent set of estimates. In each region, wells are divided into two groups, "odd-numbered" and "even-numbered". From each of these groups, approximately 5000 training wells are selected, and used to find optimal CF, IE, and DR via Nelder-Mead optimization algorithm. To prevent estimation bias, CF, IE, DR estimates obtained from a sample of "odd-numbered" wells are used to basecall (solve) all "even-numbered" wells in the same regions, and vice versa. Once obtained, all 64 x 2 sets of parameter estimates are passed to the solver.
Solver
The solver uses the measured incorporation signal, the phase estimates, and the droop estimates to determine the most likely base sequence in the well. The solver achieves this by repeatedly constructing predicted signals for partial base sequences and evaluating their fit to the measured signal. The predicted signals are generated by a highly efficient dynamic programming algorithm. These signals are further used by the solver to perform a branch-and-bound search through the tree of partial base sequences. The solver keeps a list of promising partial sequences. At each step, it selects the most promising sequence and extends it by one base into four new longer partial sequences. These new candidates are checked against a set of fit criteria, and those that pass them are added to the list. The list size is limited and the excess sequences are discarded based on a fit heuristic. When none of the entries on the list yield a better fit than the best sequence examined thus far, the tree search concludes.
Normalization
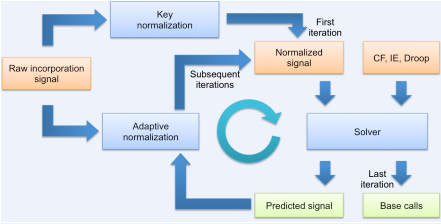
The solver expects that in absence of phasing and droop, the measured signal for flows incorporating a 1-mer is very close to 1, and for non-incorporating flows very close to zero. In practice, the measured incorporation signal can deviate from this assumption by an additive offset and a multiplicative scaling that slowly varies with the flow number and is different for each read. This is addressed by normalizing the signal before it is passed to the solver. Before the first execution of the solver, a key normalization preliminarily scales the measurements by a constant factor. The factor is selected to bring the signal of the known expected 1-mers produced by sequencing through the key as close to unity as possible. Once the solver has guessed a sequence, the corresponding predicted signal is leveraged for adaptive normalization. Adaptive normalization compares the predicted signal to the measured incorporation signal to fit the flow-varying additive and multiplicative terms, and subsequently generates an improved normalized signal with the distortion removed (or at least reduced). Adaptive normalization is invoked iteratively with the solver for several rounds, allowing the normalized signal and the predicted signal to converge towards the best solution.
Read filtering and trimming
Read filtering involves generation of various quality metrics for each base call, quality metrics for each read, and using those metrics to filter out low quality reads and trim reads back to acceptable quality levels. Additionally, adapter trimming is performed on the ends of each read.
See:
Technical Note - Filtering and Trimming
Technical Note - Quality Score
Per-base quality scoring
Per-base quality scores are assigned to each read, and written to the unmapped BAM file along with the read itself. The per-base quality scores are assigned by calculating various metrics for the read and using those metrics as lookup indexes into a pre-defined quality lookup table established through prior system training. The metrics often involve estimates of accuracy at the current base, flow, and earlier or later bases or flows for each read.
Filtering
Filtering reads involves calculating an overall quality metric representing the basecaller capability to accurately correct and base call the raw signals. Reads that have calculated low quality are not written to the unmapped BAM file. Low quality reads are typically mixed reads or very low copy-count reads that produce low quality sequence such that they do not fit the expected incorporation model.
Quality and adapter trimming
Using processing algorithms, a read can be trimmed back until an acceptable level of quality persists for the entire read. A read is also examined to determine if the B-Primer adapter sequence or a portion thereof can be identified with high confidence within the read. If a matching sequence is found, the read is trimmed to the base immediately prior to the start of the adapter.
Alignment QC
The alignment QC stage involves alignment of reads produced by the pipeline to a reference genome, and extracting metrics from those alignments. Currently, the TMAP aligner is used to align reads. As inputs to the aligner, some or all of the reads produced in the pipeline are used, along with the reference genome and index files. The output is a BAM file. This output BAM file is processed to extract various quality metrics, including estimates of Q20 bases, estimates of number of reads at or above 100Q20. The results of the Alignment QC module are viewable using the Torrent Browser web interface in the Reports summary page. The key output component is the BAM file.
Data files produced
See Quickstart On Dataflow for a listing ofthe files output at each stage or module, along with their expected size for typical runs.
