Torrent Browser Analysis Report Guide
Classic Test Fragment Report
This page describes the old style run reports used before release 3.0. The old style run reports use an older layout and do not offer 4.x features. The Classic run report is viewed with the Classic Report button (near the top right of a run report page):

The Test Fragment Summary section of the Analysis Reportprovides information about the performance of each Test Fragment included in the experiment.
The report has a heading for each Test Fragment, in the form Test Fragment - < TestFragmentName > .
Test Fragments are used during analysis to predict the CF/IE/DR values for each Test Fragment, regionally.Analysis results for a Test Fragmentare displayed when there are at least 1000 high-quality Test Fragments, where there is an 85% match against the appropriate template in the Test Fragmentlist. This includes CF/IE/DR estimates and performance calculations.
Test Fragment Summary
The Test Fragment Summary part of the Test Fragment Report displays the following information:
Test Fragment List

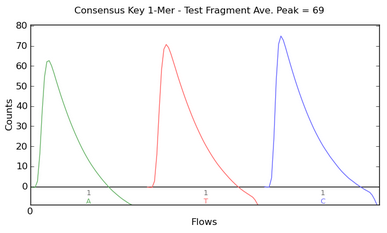
Consensus Key 1-Mer
The Consensus Key 1-Mer graph shows the strength of the signal from the first three one-mer bases of the Test Fragment key. This graph represents the consensus signal measurement of release of H+ during nucleotide incorporation.

The y-axis shows signal strength, measured in Counts, which is an arbitrary but consistent unit of measure. The x-axis shows time as nucleotide Flows over the chip.
There is a known key at the beginning of every read. Typically, three bases are shown of the 4-mer key. Note that the graph is displayed in "flow order" rather than "base order." For example, the four-base Test Fragment key is typically ATCG for nucleotides one through four and is graphed as ATC, representing the nucleotide flow order. Negative flows are not displayed.
Quality Metrics
The
Quality Metrics
part of the
Test Fragment Report
displays the following information:

|
Parameter |
Description |
|---|---|
|
TF Name |
Test Fragment name, as defined in the Templates tab of Torrent Browser. |
|
TF Seq |
Test Fragment sequence. |
|
Num |
Number of filtered & trimmed reads identified for this Test Fragment. |
|
Avg Q17 read length |
Average read length with Q17, or better, for this Test Fragment. |
|
50AQ17 |
Number of reads for this Test Fragment with a minimum of 50 base pairs in length and an error rate of 1 in 50, Phred-like 17, or better. Quality is based on alignment, not predicted quality. |
Graphs
The Graphs part of the Test Fragment Report displays the following information:
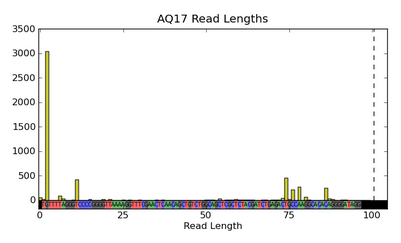
AQ17 Read Lengths
The AQ17 Read Lengths graph is a histogram of read lengths, in bp units, that have a Phred-like score of 17 or better, or one error in 50 bp.
Distributions skewed to the right are ideal, showing longer read lengths (remembering that Test Fragments are a discrete length). It is likely that the sequence can extend all the way through the Test Fragment, if enough flows are run, so the histogram only displays a maximum size based on the length of the Test Fragment.

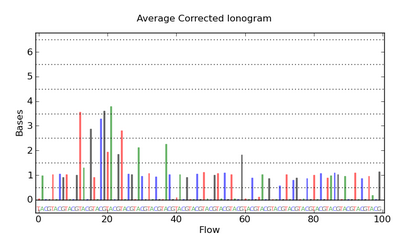
Average Corrected Ionogram
In the Average Corrected Ionogram graph, the x-axis is in flow space and the y-axis shows the signal intensity.
A unit of one indicates that there is only one base. A unit of two indicates that there are two bases of that specific nucleotide incorporated during the single flow event.


