Torrent Browser Analysis Report Guide
Classic Library Summary Report
This page describes the old style run reports used before release 3.0. The old style run reports use an older layout and do not offer 4.x features. The Classic run report is viewed with the Classic Report button (near the top right of a run report page):

Performance, based on either predicted quality or quality as measured following alignment, is provided in the Library Summary section of the Detailed Report. This section of the report contains the following information:
Based on Predicted Per-Base Quality Scores - Independent of Alignment
The Based on Predicted Per-Base Quality Scores - Independent of Alignment section gives performance measurements based on predicted quality:

|
Parameter |
Description |
|---|---|
|
Total Number of Bases [Mbp] |
Number of filtered and trimmed million base pairs reported in the output files. |
|
Number of Q20 Bases [Mbp] |
Number of bases with predicted quality of Q20 or greater. |
|
Total Number of Reads |
Total number of filtered and trimmed reads independent of length reported in the output files. |
|
Mean Length [bp] |
Average length, in base pairs, of all filtered and trimmed library reads reported in the output files. |
|
Longest Read [bp] |
Maximum length, in base pairs, of all filtered and trimmed library reads reported in the file. |
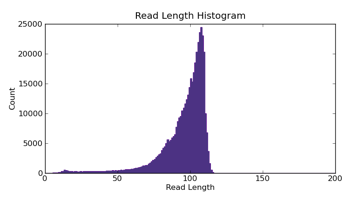
Read Length Histogram
The Read Length Histogram is a histogram of the trimmed lengths of all a reads present in the output BAM file. The following figure illustrates an example graph:

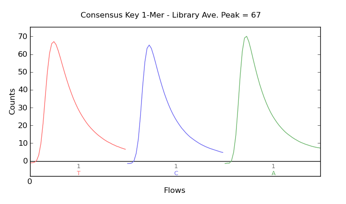
Consensus Key 1-Mer
The
Consensus Key 1-Mer
graph shows the strength of the signal from the first three one-mer bases of the library key. This graph represents the consensus signal measurement of release of H+ during nucleotide incorporation.

The y-axis shows signal strength, measured in
Counts
, which is an arbitrary but consistent unit of measure. The x-axis shows time as nucleotide
Flows
over the chip.
There is a known key at the beginning of every library read. Typically, three bases are shown of the 4-mer key. Note that the graph is displayed in "flow order" rather than "base order." For example, the four-base library key is typically TCAG for nucleotides one through four and is graphed as TCA, representing the nucleotide flow order. Negative flows are not displayed.
Q: If the library key is 4 bases, why are only three bases displayed in the key one-mer graph?
A: The next base after the last key base is the first library base. This base varies depending on the library fragment. If the last key base is a G and the first library base is a G, both of these are incorporated in the same flow resulting in a signal roughly 2X of a one-mer. Thus, the last base of the library read is not informative for quality purposes because that flow can contain library information in addition to key information. The one-mer key pass graph only contains n-1 flows for an n-mer library key.
Reference Genome Information
The Library Summary includes the Reference Genome Information :

|
Parameter |
Description |
|---|---|
|
Genome Name |
Name of reference genome. |
|
Genome Size |
Number of bases in the reference genome. |
|
Genome Version |
Version information for the genome used. |
|
Index Version |
Version information for the genome index used. |
If an alignment error occurred, a message prompts you to view the report log for information about the error.
Based on Full Library Alignment to Provided Reference
This section of the Library Summary report shows performance as measured following alignment.

|
Parameter |
Description |
|---|---|
|
Total Number of Bases [Mbp] |
Number of million of base pairs that have been aligned to the genome at the specified quality level. |
|
Mean Length [bp] |
Average length, in base pairs, of all library reads that aligned to the genome at Q20 and Perfect (the longest perfectly aligned segment). |
|
Longest Alignment [bp] |
Maximum length, in base pairs, of all library reads that aligned to the genome at a specific quality level. |
|
Mean Coverage Depth |
Average number of times that a base was independently sequenced and aligned to the reference genome. 1X means that every base was sequenced and aligned, on average, once. 2X means that every base was sequenced and aligned, on average, twice. |
|
Percentage of Library Covered [bp] |
Percentage of the reference genome that is covered at a minimum of 1X by filtered library reads at a specific quality. |
Using the TMAP Alignment Algorithm
When the reference genome is a large genome, alignment is performed on a random subset of the reads in the unmapped BAM file. You can specify sampling and the number of reads to sample on a per-genome basis. Sampling only occurs if this number is set during reference upload. Otherwise, complete alignment is performed. The values in this table areextrapolated to the full number of reads.
Read Alignment Distribution
Summarizing the alignments produces the following report format:

Each column showsdata based on alignment of the sample.
|
Column |
Description |
|---|---|
|
Read Length [bp] |
The number of bases in each read considered for the row in the table. |
|
Reads |
Number of reads with at least Read Length bases. |
|
Unmapped |
Number of reads that TMAP could not map. |
|
Excluded |
Number of reads mapped but not having 90% accuracy in first 50 bases. |
|
Clipped |
Number of reads mapped and with accuracy of greater than 90% in first 50 bases, but with align length less than the Read Length threshold. |
|
Perfect |
Number of aligned reads with zero mismatches in the first Read Length bases. |
|
1 mismatch |
Number of aligned reads with one mismatch in the first Read Length bases. |
|
2 mismatches |
Number of aligned reads with two or more mismatches in the first Read Length bases. |


