Torrent Browser Analysis Report Guide
Torrent Suite Software space on Ion Community
Run Report Metrics Before Alignment
The Unaligned area in the Run Summary section provides before-alignment metrics. There are three sections in the Unaligned area:
ISP Density
ISP Summary
Read Length
Note:
Click the magnifying glass icon
 in the run report to open a larger image.
ISP Density
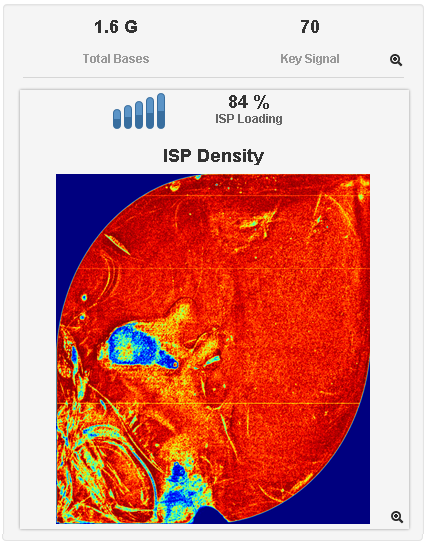
This table describes the I on Sphere Particle (ISP) density metrics:
|
Metric |
Description |
|---|---|
|
Total Bases |
Number of filtered and trimmed base pairs reported in the output BAM file. |
| Key Signal | Percentage of LiveISPs with a key signal that is identical to the library key signal. |
|
Bead Loading |
Percentage of chip wells that contain a live ISP. (T
he percentage value considers
|
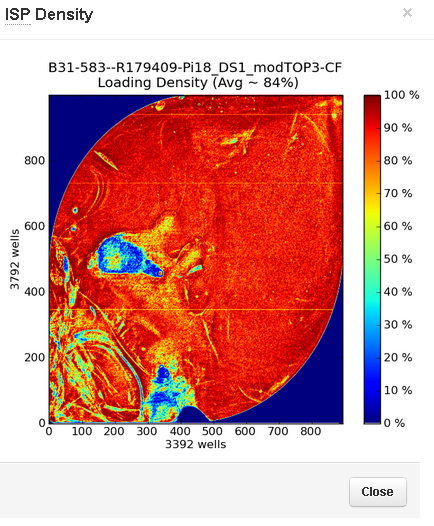
The ISP Density image is is a pseudo-color image of the Ion Chip Plate showing percent loading across the physical surface.
Click on the image (or the magnify icon
 ) to open a larger version:
Key signal
Click the magnify icon in the Key Signal area
 to open the key incorporation graphs:
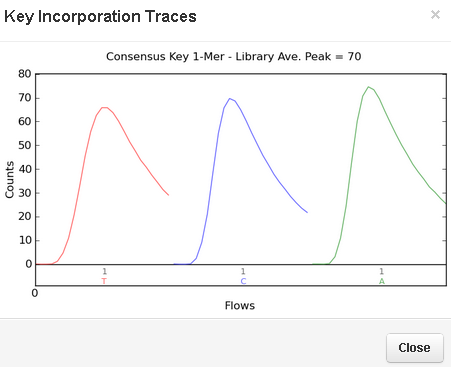
The key incorporation graph show the average signal readings for flows of the bases T, C, and A in the library key.
ISP Summary
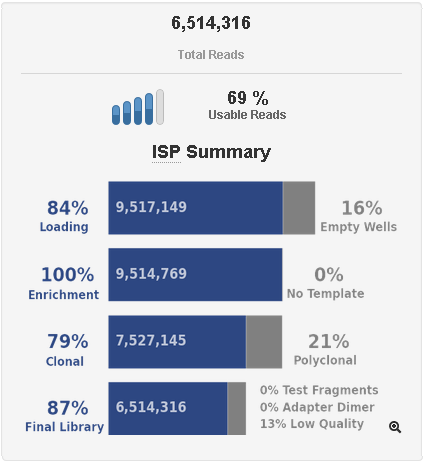
In the lower rows, the percentages are relative to the total in the next higher row. The first row gives percentages of loaded wells and empty wells, relative to the number of potentially addressable wells on the chip.
This table describes the ISP s ummary metrics:
|
Metric |
Description |
Calculation |
|---|---|---|
|
Total Reads |
Total number of filtered and trimmed reads independent of length reported in the output BAM file. |
(Not calculated) |
|
Usable Sequence |
The percentage of library ISPs that pass the polyclonal, low quality, and primer dimer filters. |
Final Library ISPs / Library ISPs |
| Loading | Percentage of chip wells that contain a live ISP. (T he percentage value considers only potentially addressable wells.) | No. of Loaded ISPs / No. of potentially addressable wells |
| Empty Wells | Percentage of chip wells that do not contain an ISP. (The percentage value considers only potentially addressable wells.) | (No. of potentially addressable wells minus No. of Loaded ISPs) / No. of potentially addressable wells |
| Enrichment |
Predicted number of Live ISPs that
have a key signal identical to the library key signal.
The Percent Enrichment value reported is the number of loaded ISPs that are Library ISPs, after taking out Test Fragment ISPs. |
Library ISPs / (No. of Loaded ISPs
|
| No Template | Percentage of chip wells that do not contain a DNA template. |
(No. of Loaded ISPs minus TF ISPs) minus (Library ISPs) / (No. of Loaded ISPs minus TF ISPs) |
| Clonal |
Percentage of clonal ISPs (all library and Test Fragment ISPs that are not polyclonal). An ISP is clonal if all of its DNA fragments are cloned from a single original template. All the fragments on such a bead are identical (and they respond in unison as each nucleotide is flowed in turn across the chip). |
No. of ISPs with single beads / No. of Live Wells |
| Polyclonal |
Percentage of polyclonal ISPs ( ISPs carrying clones from two or more templates). |
Polyclonal ISPs / Live ISPs |
| Final Library |
Percentage of reads which pass all filters and which are recorded in the output BAM file.
|
Final Library / Clonal ISPs |
| % Test Fragments |
Percentage of Live ISPs with a key signal that is identical to the test fragment key signal. |
Test Fragment ISPs /Clonal ISPs |
| % Adapter Dimer | Percentage of ISPs with an insert length of less than 8 bp. | Primer dimer ISPs /Clonal ISPs |
| % Low Quality | Percentage of ISPs with a low or unrecognizable signal. | Low quality ISPs /Clonal ISPs |
Click the ISP Summary magnify icon
 to open a larger version with also a table of metrics:
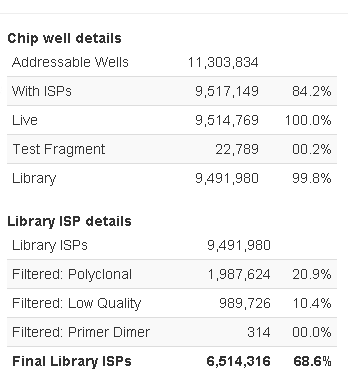
These metrics are described in this table:
|
Metric |
Description |
Calculation |
|---|---|---|
|
Addressable Wells |
Total number of addressable wells. |
(Not calculated) |
|
With ISPs |
Number (and percentage of addressable wells) of wells that were determined to be "positive" for the presence of an ISP within the well. "Positive"is determined by measuring the diffusion rate of a flow with a different pH. Wells containing ISPs have a delayed pH change due to the presence of an ISP slowing the detection of the pH change from the solution. |
Wells with ISPs / Total Addressable Wells |
|
Live
|
Number (and percentage of wells with ISPs) of wells that contained an ISP with a signal of sufficient strength and composition to be associated with the library or Test Fragment key. This value is the sum of the following categories:
|
Live ISPs / Wells with ISPs |
|
Test Fragment
|
Number (and percentage of Live ISPs) of LiveISPs with a key signal that was identical to the Test Fragment key signal. |
Test Fragment ISPs / Live ISPs |
| Library | Number (and percentage of Live ISPs) of LiveISPs with a key signal that was identical to the library key signal. | Library ISPs / Live ISPs |
|
Library ISPs |
Predicted number of Live ISPs that have a key signal identical to the library key signal (the same value as shown in the well information table on the right).
|
Library ISPs |
|
Filtered: Polyclonal |
ISPs carrying clones from two or more templates. |
Polyclonal ISPs / Library ISPs |
|
Filtered: Low quality |
Low or unrecognizable signal. |
Low quality ISPs / Library ISPs |
|
Filtered: Primer dimer |
Insert length of less than 8 bp. |
Primer dimer ISPs / Library ISPs |
|
Final Library
ISPs
|
Number (and percentage of Library ISPs) of reads passing all filters, which are recorded in the output BAM file.
|
Final Library / Library ISPs |
Read Length
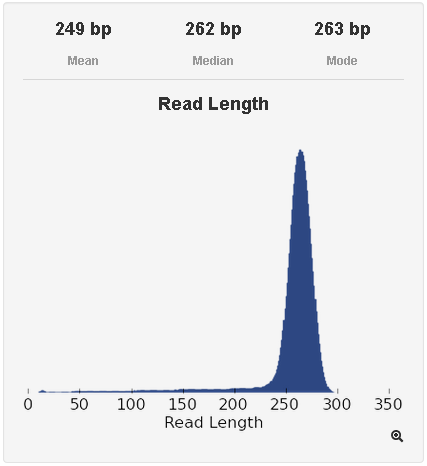
This table describes the read length
metrics:
|
Metric |
Description |
|---|---|
|
Mean Read Length |
Average length, in base pairs, of called reads. |
| Median Read Length | Median length of called reads. |
| Mode Read Length | Mode length of called reads. |
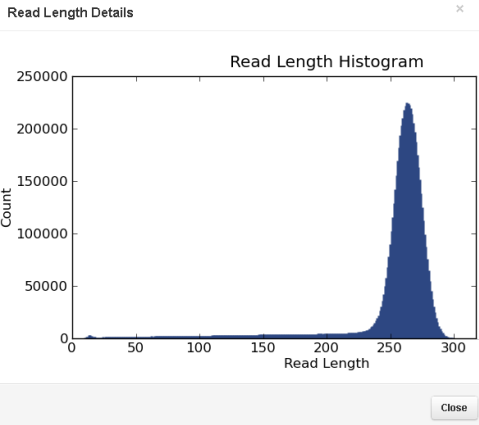
The read length histogramis a histogram of the trimmed lengths of all reads present in the output files.
Click on the histogram to open a larger version:
 Torrent Browser Analysis Report Guide
 Run Report Metrics
 Run Metrics Overview
 Run Report Metrics Before Alignment
 Run Report Metrics on Aligned Reads
 Barcode Reports
 Test Fragment Report
 Report Information
 Output Files
 Plugin Summary
 Assembler SPAdes Plugin
 Coverage Analysis Plugin
 ERCC Analysis Plugin
 FileExporter Plugin
 FilterDuplicates Plugin
 IonReporterUploader Plugin
See
 The Ion Reporter™ Software Integration Guide
 Run RecognitION Plugin
 SampleID Plugin
 TorrentSuiteCloud Plugin
 Torrent Variant Caller Plugin
 Torrent Variant Caller Parameters
 Example Torrent Variant Caller Parameter File
 Torrent Variant Caller Output
 The Command-Line Torrent Variant Caller
 Ion Reporter™ Software Features Related to Variant Calling
 Integration with TaqMan® and PCR
