Torrent Browser Analysis Report Guide
Torrent Suite Software space on Ion Community
Run Report Metrics on Aligned Reads
This section of a run report provides metrics on aligned reads.
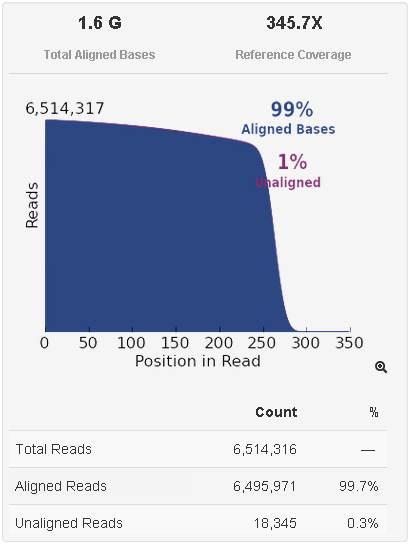
The Total Aligned Bases

The following table describes metrics in the Total Aligned bases area.
|
Metric |
Description |
|---|---|
|
Total Aligned Bases |
Number of filtered and trimmed aligned base pairs reported in the output BAM file. Total number of bases aligned to the reference sequence. Excludes the library key, barcodes, and 3' adapter sequences. |
| Reference Coverage |
The average of the number of reads that cover each reference position: t otal aligned bases divided by the number of bases in the reference sequence. Does not consider enrichment. |
|
% Aligned Bases |
Percentage of Total Aligned Bases out of all reads. |
| % Una ligned | Percentage of bases not aligned to references. |
|
Total Reads |
Number of reads generated during basecalling. |
| Aligned Reads | Number of reads that aligned to the reference genome. |
| Una ligned Reads | Number of reads that did not align to the reference genome. |
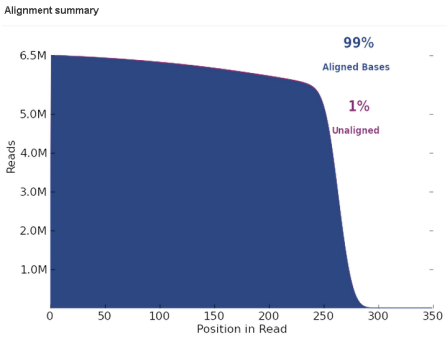
The graph in the Total Aligned reads column plots number of aligned (in blue) and unaligned (in purple) bases by position in an aligned sequence. (The purple area cannot be seen easily when it is under 3 or 4 percent.)

For each position in an aligned sequence, the height of the blue area shows the number of aligned bases at that position. The purple area shows the number of unaligned bases at that position. Unaligned bases are not shown by the absolute height on the number of bases axis, but by the difference between the purple height and the blue height.
Raw Accuracy
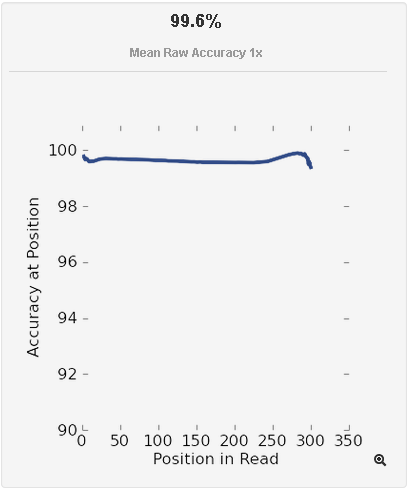
The graph in the Raw Accuracy column plots percent accuracy for each position in an aligned sequence:

|
Metric |
Description |
|---|---|
|
Mean Raw Accuracy 1x |
Average raw accuracy of 1-mers plotted by their position in the read. |
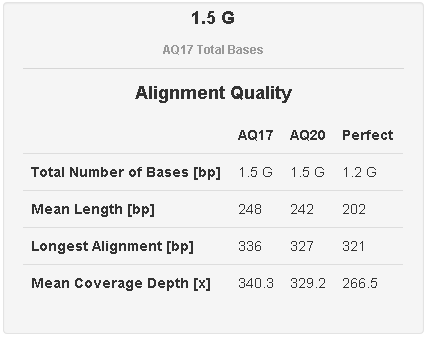
Alignment Quality
See also Run Metrics Overview for information on alignment quality calculations.

| Metric | Description |
|---|---|
| AQ17 | An error rate of 2% or less. |
| AQ20 | An error rate of 1% or less. |
| Perfect | The longest perfectly aligned segment. |
| Total Number of Bases | Total number of bases at the quality level. |
| Mean Length | Average segment length at the quality level. |
| Mean Coverage Depth | Average coverage at the quality level. |
 Torrent Browser Analysis Report Guide
 Run Report Metrics
 Run Metrics Overview
 Run Report Metrics Before Alignment
 Run Report Metrics on Aligned Reads
 Barcode Reports
 Test Fragment Report
 Report Information
 Output Files
 Plugin Summary
 Assembler SPAdes Plugin
 Coverage Analysis Plugin
 ERCC Analysis Plugin
 FileExporter Plugin
 FilterDuplicates Plugin
 IonReporterUploader Plugin
See
 The Ion Reporter™ Software Integration Guide
 Run RecognitION Plugin
 SampleID Plugin
 TorrentSuiteCloud Plugin
 Torrent Variant Caller Plugin
 Torrent Variant Caller Parameters
 Example Torrent Variant Caller Parameter File
 Torrent Variant Caller Output
 The Command-Line Torrent Variant Caller
 Ion Reporter™ Software Features Related to Variant Calling
 Integration with TaqMan® and PCR

