Torrent Browser Analysis Report Guide
Torrent Suite Software space on Ion Community
Coverage Analysis Plugin
The Coverage Analysis plugin provides statistics and graphs describing the level of sequence coverage produced for targeted genomic regions.
The plugin's documentation is embedded in its output page. Access the documentation through help and options icons in the top right corner of a chart:

Run the Coverage Analysis plugin
You can run the Coverage Analysis plugin automatically or manually.
Include the Coverage Analysis plugin in a run plan
To run theCoverage Analysis plugin automatically, you select Coverage Analysis plugin during template setup. Refer to the Plan Tab and Templates pages section of the Torrent Browser User Interface Guide for information about how to set up a template and create a planned run.
Manually launch the Coverage Analysis plugin
To run the Coverage Analysis plugin manually, perform the following steps:
1. In the Torrent Browser, select a run report by clicking a run link, then clicking a report from the dropdown area. The run report opens.
2. On the run report page, scroll about halfway down the screen to the Plugin Summary area. Click Select plugins to run . The Select a plugin popup appears:
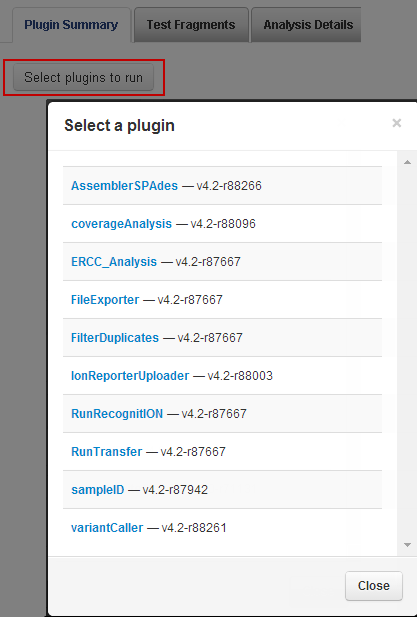
3. Select coverageAnalysis . TheCoverage AnalysisPlugin interface appears.
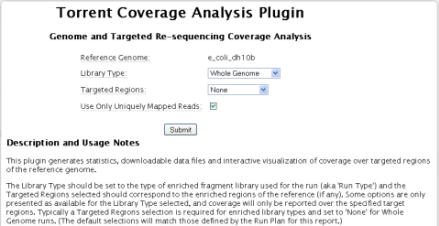
4. Select a library type.
5. If you have one and would like to use it, select a targeted regions file.
6. Fill out the other plugin options. These options vary depending on your Library Type selection:
- Target Padding If you would like to pad the target by a number of bases, enter the desired number. If you do not enter a number,the default of 0 is used.
- Use Only Uniquely Mapped Reads If you would like the plugin to examine only unique starts, select the checkbox.
- Use Only Non-duplicate Reads Select the checkbox to avoid duplicates. The Torrent Suite analysis must have been run with Mark Duplicates enabled.
- SampleID Tracking Check this only if the Ion AmpliSeq library employed sampleID tracking amplicons.
7. When you are satisfied with your selections, click Submit .
The analysis runs and a group of output reports is created.
The following sections of this document describe the output reports generated by theCoverage Analysisplugin.
Coverage Analysis Plugin output
The plugin generates a Coverage Analysis Report. This report includes read statistics and several charts. The statistics and charts presented depend on the library type for the analysis. I n addition, in the File Links section at the bottom ofthe Coverage Analysis Report, you can download statistics files and the aligned reads BAM file.
Most Coverage Analysis chart have help and options icons in the top right corner:

Click a chart's help icon
 to open a description of the chart.
Click a chart's options icon
 to open a panel of options for the chart.
Most fields in the report offer hover help.
Example statistics
The following is an example of the plugin statistics for a whole genome run. Most fields names offer hover help.

Click on the Coverage Overview graph to see a larger image (then click Back in your browser to return to the report).
Reads statistics
The library type determines which statistics are presented.
|
Statistic |
Description |
|---|---|
|
Number of mapped reads |
Total number of reads mapped to the reference. |
|
Number of reads on target |
Total number of reads mapped to any targeted region of the reference. A read is considered to be on target if at least one alignedbaseoverlaps a target region. A read that overlaps a targeted region but where only flanking sequence is aligned, for example, due to poor matching of 5' bases of the read, is not counted. |
| Target Base Coverage |
Summary statistics for targeted base reads of the reference.
|
| Bases in target regions | The total number of bases in all specified target regions of the reference. |
|
Percent of reads on target |
The percentage of reads mapped to any targeted region relative to all reads mapped to the reference. |
|
Total aligned base reads |
The total number of bases covered by reads aligned to the reference. |
|
Total base reads on target |
The total number of target bases covered by any number of aligned reads. |
|
Percent base reads on target |
The percent of all bases covered by reads aligned to the reference that covered bases in target regions. |
|
Bases in targeted reference |
The total number of bases in all target regions of the reference. |
|
Bases covered (at least 1x) |
The total number of target bases that had at least one read aligned over the proximal sequence. Only the aligned parts of each read are considered. For example, unaligned (soft-cut) bases at the 5' ends of mapped reads are not considered. Covered target reference bases may include sample DNA read base mismatches, but does not include read base deletions in the read, nor insertions between reference bases. |
|
Average base coverage depth |
The average number of reads of all targeted reference bases. |
|
Uniformity of base coverage |
The percentage of bases in all targeted regions (or whole genome)covered by at least 0.2x the average base coverage depth. |
|
Maximum base read depth |
The maximum number of times any single target base was read. |
|
Average base read depth |
The average number of reads of all targeted reference bases that were read at least once. |
|
Std.Dev base read depth |
The standard deviation (root variance) of the read depts of all targeted reference bases that were read at least once. |
| Genome Base Coverage |
Summary statistics for base reads of the reference genome. |
| Genome base coverage at N x | The percentage of reference genome bases covered by at least N reads. |
|
Target coverage at N x |
The percentage of target bases covered by at least N reads. |
| Targets with no strand bias |
The percentage of all targets that did not show a bias towards forward or reverse strand read alignments. An individual target is considered to have read bias if it has at least 10 reads and the fraction of forward or reverse reads to total reads is greater than 70%. |
| Amplicon Read Coverage |
Summary statistics for reads assigned to specific amplicons.
|
| Number of amplicons | The number of amplicons specified in the target regions file. |
| Percent assigned amplicon reads |
The total number of reads that were assigned to individual amplicons.
|
| Average reads per amplicon | The average number of reads assigned to amplicons. |
| Uniformity of amplicon coverage | The percentage of bases in all targeted regions (or whole genome) covered by at least 0.2x the average base read depth. |
| Amplicons with at least N reads | The percentage of all amplicons that had at least N reads. |
| Amplicons with no strand bias | The percentage of all amplicons that did not show a bias towards forward or reverse strand read alignments. An individual amplicon is considered to have read bias if it has at least 10 reads and the fraction of forward or reverse reads to total reads is greater than 70%. |
| Amplicons reading end-to-end | The percentage of all amplicons that were considered to have a sufficient proportion of assigned reads (70%) that covered the whole amplicon target from 'end-to-end'. To allow for error the effective ends of the amplicon region for read alignment are within 2 bases of the actual ends of the region. |
Example charts
This section shows a couple example charts. Many charts have a Plot menu that allows you to change characteristics of the chart, for instance, to show both strands.
Click a chart's options icon
 (in the top right corner of a chart) to open the charts viewing options panel.
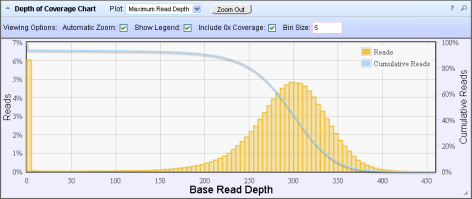
In the Depth of Coverage chart above, the left Y-axis (% reads) is the number of reads at a particular read depth (or bin of read depths) as a percentage of the total number of (base) reads.
The right Y-axis (% cumulative reads) is the cumulative count of the number of reads at a given read depth
or greater
as a percentage of the total number of (base) reads.
If your analysis includes a regions of interest file, this chart reflects only targeted reads (reads that fall within a region of interest).
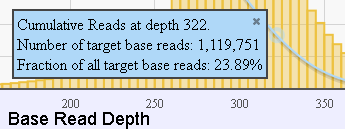
In most charts you click on a data point to open a detail panel for that data:
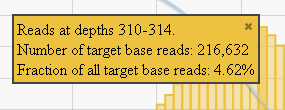
In this chart, the blue curve measures the cumulative reads at that read depth or greater. Click a point on the blue curve to open the blue detail panel for that read depth:
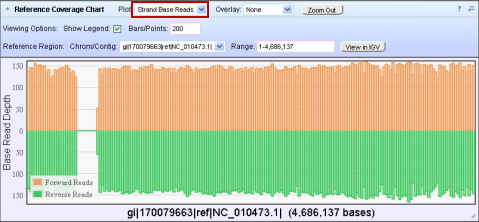
The following Reference Coverage Chart is shown with the Strand Base Reads option:
Note:
The Viewing options panel is revealed or hidden with the
chart's options icon
 . The
help icon
 opens a description of the chart.
Output files
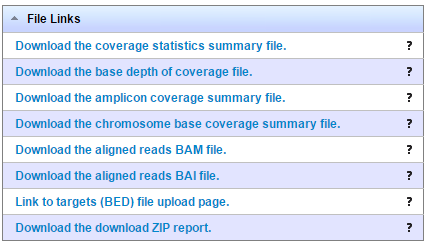
You download plugin results file from links in the File Links section. This example is from a generic sequence run:
 Ion TargetSeq
analyses also offer the option "Download the targetseq coverage summary file".
Ion AmpliSeq analyses also offer the option "Download the amplicon coverage summary file".
Click a file's question mark icon
 to open a description of the file:

The following table lists the output files with a description of each. Not all output files are generated on every type of analysis.
| File | Description |
|---|---|
| Coverage statistics summary |
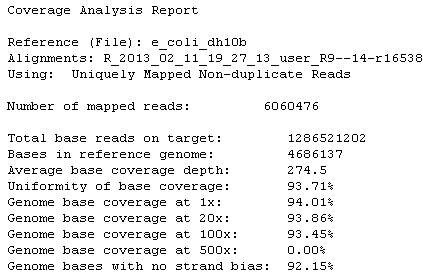
A summary of the statistics presented in the tables at the top of the plugin report. The first line is the title. Each subsequent line is either blank or a particular statistic title followed by a colon (:) and its value. See also Example Coverage Analysis Report . |
| Base depth of coverage |
Coverage summary data used to create the Depth of Coverage Chart. This file contains these fields:
|
| Amplicon coverage summary |
Coverage summary data used to create the Amplicon Coverage Chart. This file contains these fields:
|
| Target coverage summary |
Coverage summary data used to create the Target Coverage Chart. This file contains fields:
|
| Chromosome base coverage summary |
Base reads per chromosome summary data used to create the default view of the Reference Coverage Chart. This file contain s these fields:
|
| Aligned reads BAM file | Contains all aligned reads used to generate this report page, in BAM format. BAM is the binary form of the SAM format file that records individual reads and their alignment to the reference genome. Refer to the current SAM tools documentation for more file format information. |
| Aligned reads BAI file | Binary BAM index file as required by some analysis tools and alignment viewers such as IGV. |
| Primer-trimmed reads BAM file. | Binary primer-trimmed aligned reads. Created from the original alignment file by trimming reads to specific amplicons regions they are assigned to, where necessary to resolve overlaps with multiple amplicon target regions. |
| Primer-trimmed reads BAI file. | Binary BAM index file as required by some analysis tools and alignment viewers such as IGV. |
Example Coverage Analysis Report
 Torrent Browser Analysis Report Guide
 Run Report Metrics
 Run Metrics Overview
 Run Report Metrics Before Alignment
 Run Report Metrics on Aligned Reads
 Barcode Reports
 Test Fragment Report
 Report Information
 Output Files
 Plugin Summary
 Assembler SPAdes Plugin
 Coverage Analysis Plugin
 ERCC Analysis Plugin
 FileExporter Plugin
 FilterDuplicates Plugin
 IonReporterUploader Plugin
See
 The Ion Reporter™ Software Integration Guide
 Run RecognitION Plugin
 SampleID Plugin
 TorrentSuiteCloud Plugin
 Torrent Variant Caller Plugin
 Torrent Variant Caller Parameters
 Example Torrent Variant Caller Parameter File
 Torrent Variant Caller Output
 The Command-Line Torrent Variant Caller
 Ion Reporter™ Software Features Related to Variant Calling
 Integration with TaqMan® and PCR
